 Scimitar Research has been more than just a service provider; they've been a true partner. We've collaborated on numerous projects, and their proactive approach, innovative thinking, and ability to deliver results even under tight deadlines are key reasons why we consistently turn to them.


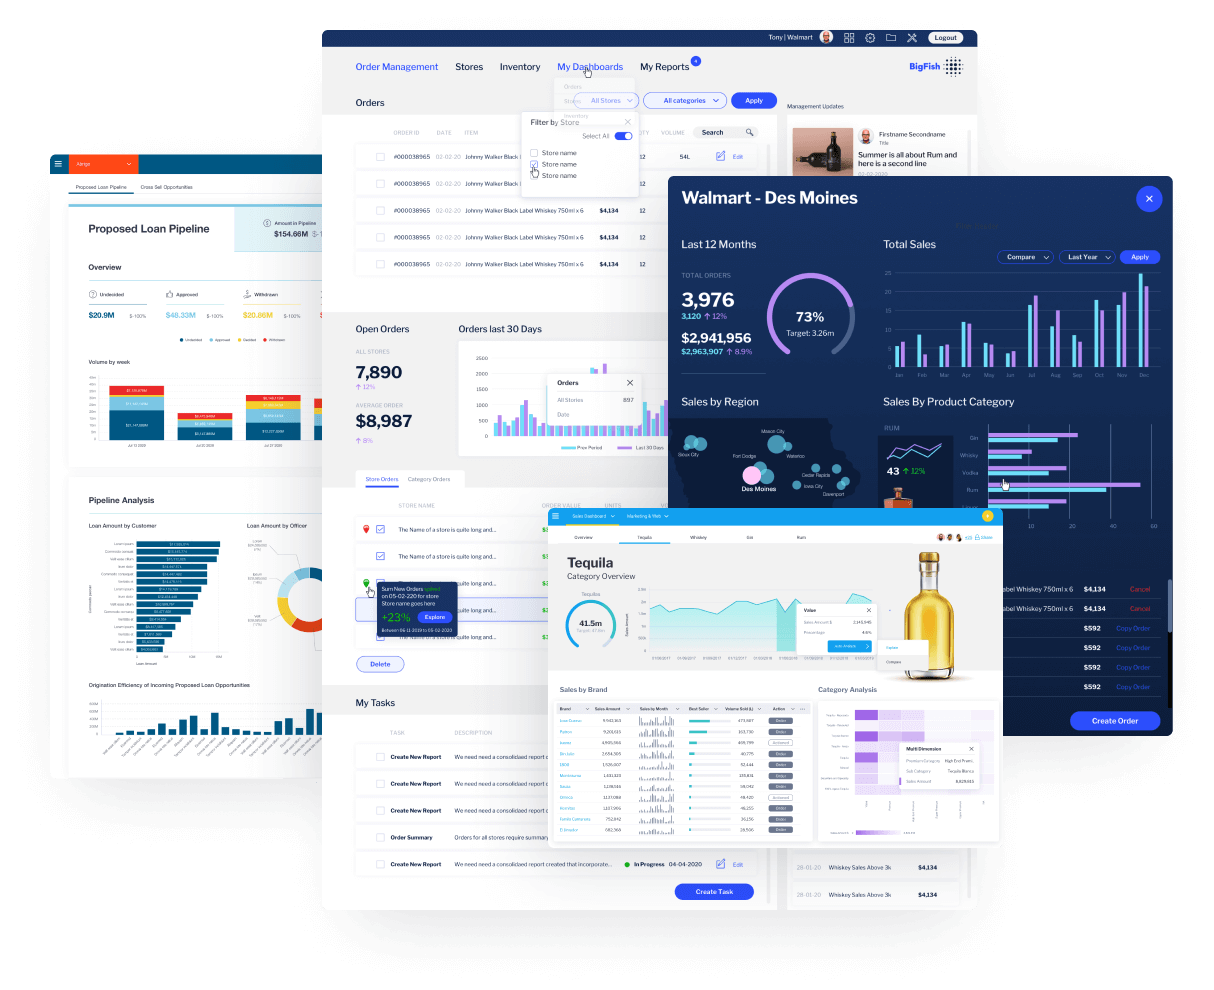
Create smart, beautiful, augmented dashboards
A Scim dashboard is the best way to visualize, monitor and understand your data to drive action. That's because they look amazing, are simple to build, and deliver automated insights. With greater flexibility and visionary functionality, you can do things never before done in a dashboard, helping you do what you do best. View Dashboard Gallery
SIMPLY THE BEST
YOU CAN DO MORE WITH SCIM DASHBOARDS
Being beautiful is just the start. Visualize data from different data sources, spread strategic and operational dashboards over multiple tabs and bring operational dashboard reports to life with sparklines and contextual actions. ScimBi dashboards are also the perfect platform to embed or develop internal or external analytical applications, because they are the only dashboard product in the world that combines a unique set of capabilities, including data storytelling and automation with true design flexibility.
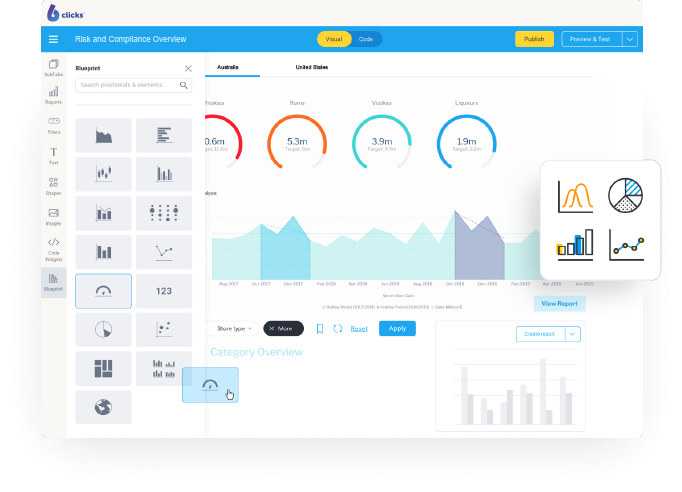
Beautiful
ScimBi has created a free-form dashboard that canvas designers (and end users) will love. Drag and drop charts and a range of graphic tools to easily assemble creative, pixel-perfect and on-brand infographics and dashboards. With Canvas you have the freedom, in any grid or layout, to create engaging analytic experiences by adding shapes, text and images, and then augment the dashboard experience with automation and data storytelling.
ScimBI Signals: Constantly Monitoring Your
Business Data
With ScimBi Signals, you know when, what and importantly, why something happened. Combined with threshold alerts, it’s your shortcut from data to insights so you can confidently jump straight to actionable conclusions. Signals is also part of the only analytics suite that combines automated data discovery, action based dashboards and data storytelling into an integrated platform enabling you to extract transformational value from your data.
Revolutionize Your Data
Flows with Data Storytelling
Unlock the transformative potential of your business data with ScimBI's data storytelling tools, ScimBI Stories and ScimBI Present. Foster a data-driven culture where metrics are supported by compelling narratives that not only illustrate trends and provide deeper context, but also drive actionable decisions

Self-service BI — insights for anyone
To get the most value from your data, you need to be able to explore your data, discover patterns and outliers, and share your insights with others. This applies to everyone in your business — from business users to data analysts. ScimBI’s intuitive self-service BI options accelerate discovery and allow everyone to share insights in a governed way.

SCIMITAR RESEARCH
© 2024 SCIMITAR RESEARCH All Rights Reserved