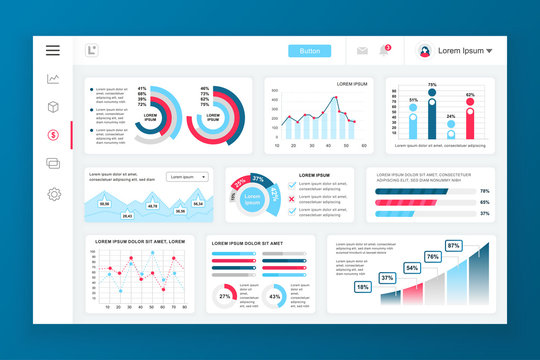
Empowering Decisions Through Data Insights
Elevate your business with our Business Intelligence (BI) service. Convert complex data into actionable insights through intuitive visualizations. Make smarter decisions, proactively tackle challenges, and seize opportunities with confidence. Elevate your business strategy with data-driven precision. Choose Business Intelligence for informed success.
Our Expertise
CFO Dashboard
SaaS company dashboard
Revenue dashboard
Cash flow dashboard
Fundraising dashboard
What We Do..
Business Intelligence empowers informed decisions by transforming raw data into actionable insights, driving efficiency, and enabling proactive strategies for sustainable growth.
Collect & Gather
Gather data from diverse sources, including internal systems and external platforms, ensuring a comprehensive data pool.
Data Transformation
Clean, organize, and structure the collected data to ensure consistency and accuracy, making it ready for analysis..
Data Analysis:
Utilize advanced analytics tools to process and analyze the data, identifying patterns, trends, and relationships.
Insight Presentation
Present findings through visually appealing dashboards, reports, and visualizations, enabling informed decision-making at all levels of the organization.
Our Delivery Mechanisms
Understanding the problem
Problems are revealed through data anomalies, user feedback, user input, and performance changes. Vigilant monitoring and engagement ensure precise insights and action-ready data.
Collection of Data
Data stored on-premises is collected internally, while data on Cloud servers like AWS, GCP, or Azure is acquired through Data Engineering processes. Diverse sources, including databases, APIs, spreadsheets, and external platforms, are tapped for data collection.
Data Processing & Analysis
Cleanse, transform, and structure the raw data into a standardized format for consistency and accuracy. Utilize analytical tools and algorithms to derive meaningful insights, identifying trends, outliers, and correlations within the data.
Visualization and Sharing
Present insights through interactive dashboards, reports, and visual representations, allowing stakeholders to grasp information intuitively and make informed decisions.
